Nodinite as Both a Monitoring Tool and an Observability Platform
Nodinite represents an evolution in systems integration monitoring by combining traditional monitoring capabilities with advanced observability features. This dual nature makes Nodinite both a powerful monitoring tool and a comprehensive observability platform, creating unique value proposition for organizations that need deep insights into their integration environments.
Fundamental Differences Between Monitoring and Observability
To understand how Nodinite functions within both domains, it’s essential to first define the differences between traditional monitoring and modern observability.
Traditional monitoring primarily focuses on known problems through predefined metrics and thresholds. It is reactive in nature and responds to issues after they occur. Monitoring tools collect specific data points and generate alerts based on predetermined conditions, helping IT teams identify when something is wrong but not necessarily why.
Observability, on the other hand, seeks to understand a system’s internal state based on its external outputs. It is proactive and focuses on discovering unknown issues by correlating data from multiple sources. Observability enables deeper analysis of system behavior and helps teams understand not just what is happening, but why it’s happening.
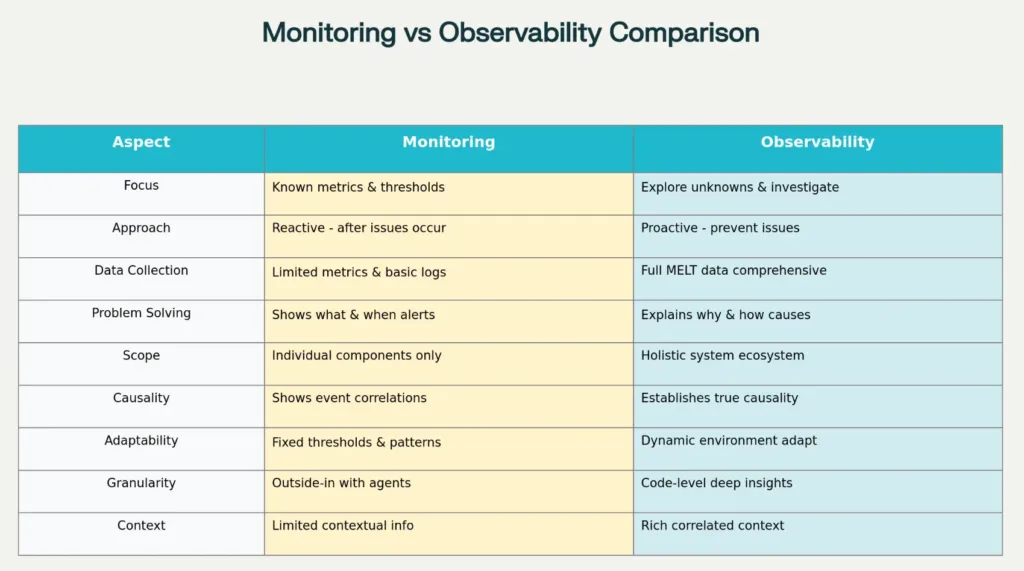
Key differences between traditional monitoring and observability approaches in IT systems management.
Nodinite as a Monitoring Tool
Nodinite fulfills all requirements of a traditional monitoring tool through its comprehensive monitoring capabilities for systems integrations.
Real-Time Monitoring and Alerting
Nodinite’s monitoring features are built on the concept of Monitoring Agents that monitor resources on-premise, hybrid, and cloud environments. These agents provide runtime information about resources and keep track of changes that can be used for analysis and reporting.
Nodinite’s monitoring capabilities include:
- Near real-time alerts through configurable Alarm Plugins
- State evaluation of resources with intuitive icons and colors
- Monitor Views that provide role-based access to monitoring data
- Non-event monitoring to detect missing or delayed messages
- Automatic discovery of resources and services
Predefined Metrics and Thresholds
As a traditional monitoring tool, Nodinite uses predefined metrics and thresholds to detect known problems. The system continuously evaluates the state of monitored resources and assigns them specific states such as “Available,” “Warning,” “Error,” or “Unavailable”.
Cross-Platform Monitoring
Nodinite supports over 50 different technologies and platforms, including:
- Azure services such as Logic Apps, Service Bus, and Application Insights
- Microsoft BizTalk Server for comprehensive integration monitoring
- ESB platforms like MuleSoft, Boomi, and WSO2
- Message queuing such as RabbitMQ, IBM MQ, and MSMQ
- Web services and APIs with automated certificate monitoring
Nodinite as an Observability Platform
While Nodinite’s monitoring capabilities are impressive, it’s the observability features that truly distinguish it from traditional monitoring tools.
The Three Pillars of Observability
Nodinite implements all three foundational pillars of observability; metrics, logs, and traces.
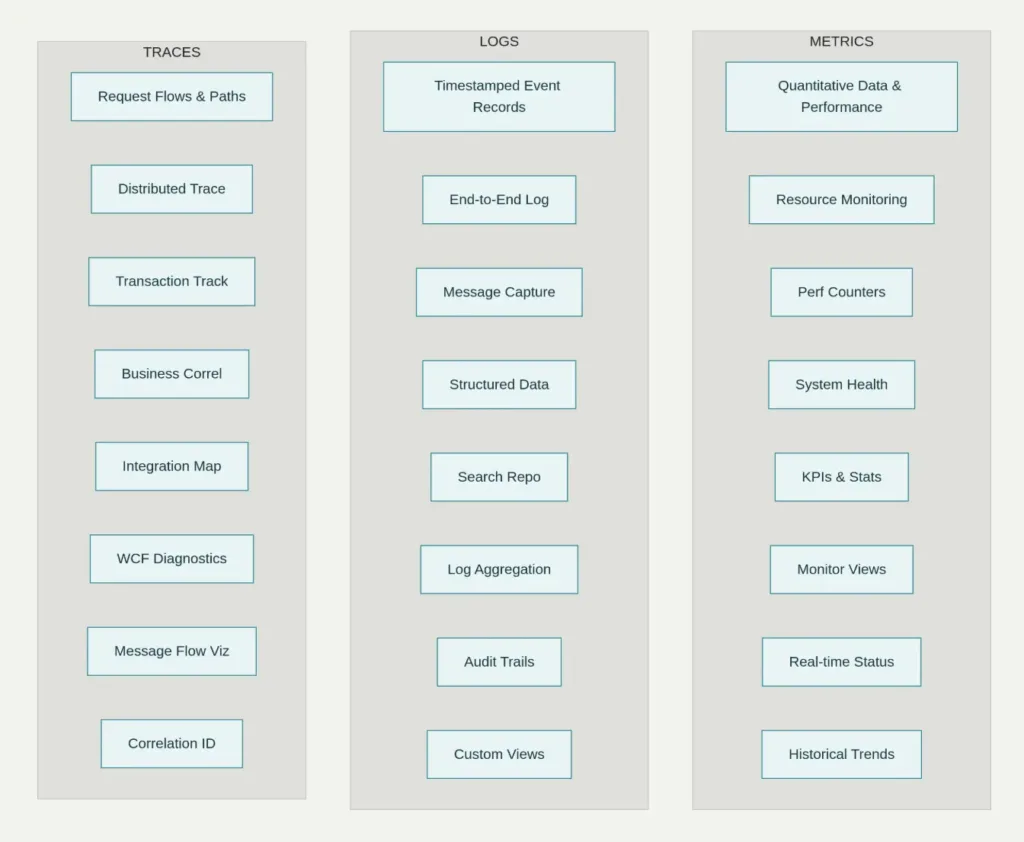
The three pillars of observability and Nodinite’s implementation of each pillar.
Metrics
Nodinite collects and presents quantitative data through:
- Dashboard visualizations with pie charts and statistics
- KPIs and trend analysis for performance optimization
- Historical data analysis for capacity planning
- Power BI integration for advanced analytics and reporting
Logs
Nodinite’s logging capabilities are comprehensive and include:
- End-to-end logging from all integration platforms
- Structured and unstructured log data with searchable repositories
- Log Agents that create Log Events from various sources
- Customizable log views with role-based access
- Audit trails for all sensitive operations
Traces
Distributed tracing features enable:
- WCF (Windows Communications Foundation) Diagnostics Tracing for complete traceability
- End-to-end transaction tracking across multiple systems
- Business process correlation through Repository Model
- Integration landscape mapping to visualize dependencies
Contextual Insights and Root Cause Analysis
One of the most powerful observability aspects of Nodinite is its ability to provide contextual insights through the Repository Model. This system functions as a CMDB-inspired database that documents integrations with custom metadata, enabling:
- Root cause analysis through correlation of technical events with business context
- Contextual alerts that include relevant metadata such as system owners and SLA levels
- Knowledge base articles integrated with monitoring resources for faster problem resolution
- Integration landscape visualization to understand system dependencies
Proactive Problem Identification
Unlike traditional monitoring that reacts to predetermined conditions, Nodinite’s observability capabilities provide:
- Automatic discovery of unknown issues through intelligent algorithms
- Predictive maintenance capability through AI and machine learning features
- Trend analysis to identify potential problems before they impact business
- Anomaly detection to discover unusual behavioral patterns
The Hybrid Approach: Best of Both Worlds
What makes Nodinite unique is its ability to function as both a monitoring tool and observability platform simultaneously. This hybrid capability manifests in several ways:
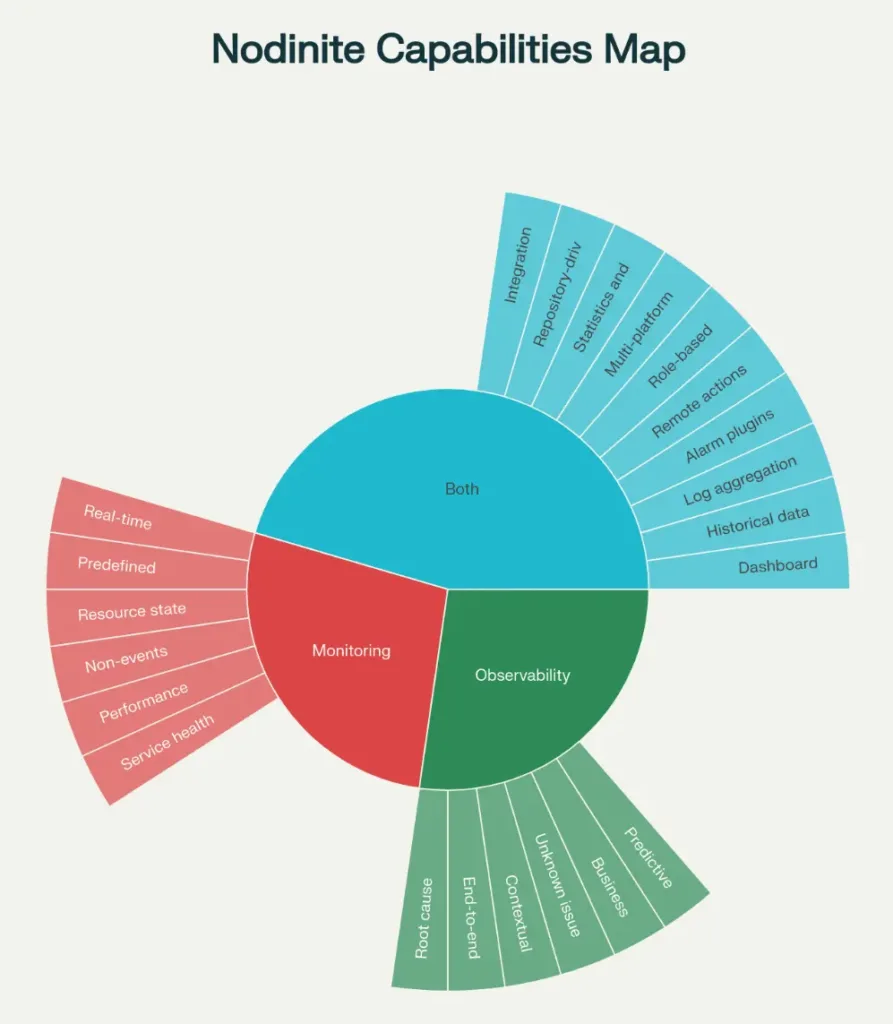
Nodinite’s capabilities positioned across monitoring and observability domains.
Integrated Architecture
Nodinite’s architecture seamlessly integrates monitoring and observability through:
- Unified data collection from all sources with consistent API
- Correlation capabilities that connect metrics, logs, and traces
- Cohesive user experience where monitoring and observability coexist in the same interface
Self-Service across departments
Nodinite enables self-service by giving business users access to both monitoring and observability data:
- Role-based Monitor Views provide users access to relevant data
- Self-service capabilities reduce dependency on IT departments
- Remote Actions allow authorized users to take corrective measures
- Auto Healing automates problem resolution based on predefined rules
Business Value Through Combined Insights
By combining monitoring and observability, Nodinite creates unique business value:
Eliminating the “blame game”; through transparent logging and traceability, uncertainty around data flows and problem causes is eliminated. Boliden, a Swedish mining and smelting company, experienced this by gaining visibility into their 400 integrations and 400,000 messages per day.
Faster ROI; organizations like Boliden achieved positive return on investment within 3-4 months instead of the expected year, thanks to the combined monitoring and observability capabilities.
Improved collaboration; by providing both technical monitoring data and business context via Repository Model, collaboration between IT and business teams improves.
Technological Evolution
Nodinite’s position as both a monitoring tool and observability platform reflects the broader evolution in IT monitoring. Modern organizations don’t need to choose between monitoring and observability – they need both.
Scalability and Adaptability
Nodinite’s hybrid architecture enables both vertical and horizontal scaling to meet performance requirements:
- Distributed agents can be installed anywhere; on-premise or in the cloud
- Flexible connectivity model supports both TCP/IP and Service Bus Relaying
- Customizable SDKs for creating custom monitoring agents
- Open API architecture for integration with external systems
Conclusion
Nodinite represents the natural evolution from traditional system monitoring to modern observability within systems integration. By maintaining the strong foundations from the monitoring domain, near real-time alerts, predefined metrics, and state management, and combining these with advanced observability capabilities such as distributed tracing, contextual analysis, and predictive insights, Nodinite creates a unique market position.
Organizations no longer need to choose between monitoring and observability. With Nodinite, they get a unified tool that delivers the best of both worlds: reliable, proven monitoring functionality combined with innovative observability capabilities that enable deeper understanding and proactive management of complex integration environments.
This dual nature makes Nodinite particularly valuable for modern organizations managing increasingly complex integration environments where traditional monitoring is no longer sufficient, but where the power of observability can be leveraged to create real competitive advantage through improved system reliability, shorter problem resolution times, and higher business agility.
")